Continuing our series on systems programming, last time we built a syscall logger. Today, we’re going deeper into the network stack with a network packet parser using eBPF and Rust. This logic is the backbone of modern network observability, security, and performance tools. By the end, you’ll understand how to safely extract protocol fields from raw packets at kernel speed—and how this foundation can be extended to build firewalls, traffic monitors, or even protocol analyzers.
What is a Network Packet Parser?
A network packet parser is a piece of code that inspects the raw bytes of a network packet as it moves through the system. Its job is to:
- Identify protocol headers (Ethernet, IP, TCP/UDP, etc.)
- Extract fields (like source/destination IPs and ports)
- Make decisions (log, drop, redirect, etc.) based on packet contents
Uses:
Packet parsers are used in firewalls, intrusion detection systems, traffic monitoring, and performance analytics. In this tutorial, we’ll focus on parsing Ethernet, IPv4, TCP, and UDP headers safely in eBPF. This logic can be extended to support more protocols, build advanced filters, or even modify packets in flight.
Some Basic Concepts
Let’s break down the core ideas behind packet parsing in eBPF, as simply as possible:
1. 📦 What is a packet?
A network packet is just a chunk of bytes moving through your network card. It usually looks like this:
1 | +----------------+----------------+--------------------+ |
Each protocol has a fixed-size header, and the data starts at a certain offset (position) from the beginning of the packet.
2. 🧮 What is an offset?
An offset is “how many bytes from the start of the packet do we want to look at?”
- Ethernet header is 14 bytes → IP starts at offset 14
- IP header is 20 bytes → TCP starts at offset 14 + 20 = 34
So:
1 | offset = 14 (Ethernet) + 20 (IP) = 34 |
3. 🧷 Accessing via pointers
In kernel space (like eBPF), we don’t get structs like Ipv4Hdr directly.
Instead, we get access to the raw memory (bytes) of the packet.
We have to manually cast bytes at the right offset into the right struct (EthHdr, Ipv4Hdr, etc.).
But we can’t just blindly read memory.
The eBPF verifier wants to make sure we don’t read beyond packet bounds.
4. 🧾 The packet memory range
The packet is in memory between two pointers:
1 | ctx.data() // start of packet |
So, to safely read T bytes from offset N, we must check:
1 | ctx.data() + N + size_of::<T>() <= ctx.data_end() |
This ensures we’re not reading beyond the memory the packet provides.
✅ Full Explanation of ptr_at()
Here’s the safe pointer helper:
1 |
|
What it does:
- Gets start and end of the packet memory
- Gets the size of the struct you want to read (e.g., Ethernet header = 14 bytes)
- Checks if it’s safe to read that struct from the given offset
- If safe, returns a pointer to that location
This pointer is still unsafe to read, but now it’s verifier-approved!
💡 Example: Reading the IPv4 Header
1 | let ipv4hdr: *const Ipv4Hdr = ptr_at(&ctx, EthHdr::LEN)?; |
This means: “start reading an Ipv4Hdr at offset 14”.
If it’s safe, you get a pointer to the IPv4 header.
🔒 Why all this checking?
In kernel-space, safety is critical.
If your program tries to read memory it shouldn’t, the eBPF verifier will reject it.
So ptr_at makes sure you only read what’s inside the actual packet.
In simple words:ptr_at<T>(ctx, offset) = “Give me a pointer to a struct T located at offset bytes from the start of the packet — but only if that memory is inside the packet’s bounds.”
What is XDP?
XDP (eXpress Data Path) is a high-performance packet processing framework in the Linux kernel, powered by eBPF. It allows you to run custom programs at the earliest possible point in the network stack—right as packets arrive from the NIC.
This means you can inspect, filter, or redirect packets with minimal latency, making XDP ideal for firewalls, DDoS mitigation, and advanced monitoring.
Setting Up the Codebase
If you haven’t set up your development environment yet, please refer to the previous blog:
Track Linux Syscalls with Rust and eBPF
To start, follow the Rust eBPF development setup instructions provided by the Aya project.
Generate a new eBPF project template:
1 | cargo generate -a aya-rs/aya-template -n xdp_packet_parser |
- Select xdp as the type of eBPF program when prompted.
Main Packet Parsing Logic
Let’s walk through the key steps of our XDP packet parser.
1. Get the IPv4 packets from the input packet stream
1 | let ethhdr: *const EthHdr = ptr_at(&ctx, 0)?; |
- Extract the Ethernet header at offset 0.
- If the EtherType is IPv4, continue parsing; otherwise, let the packet pass.
2. Extracting and Logging Parameters
1 | fn try_xdp_firewall(ctx: XdpContext) -> Result<u32, ()> { |
- Extract and log Ethernet, IP, and TCP/UDP header fields.
- This is the foundation for building firewalls, traffic counters, or protocol analyzers.
3. The ptr_at Helper
1 |
|
- Ensures you only read memory within the packet’s bounds.
- Returns a pointer to the struct at the given offset, or an error if out-of-bounds.
4. The XDP Firewall Entry Point
1 |
|
- Calls the parser and returns either the XDP action or aborts on error.
5. Putting It All Together
Here’s the complete eBPF program:
1 | // inside xdp_packet_parser/xdp_packet_parser-ebpf/src/main.rs |
Loading and Attaching the Program
Here’s a minimal Rust user-space loader to attach your XDP program to a network interface:
1 | // inside inside xdp_packet_parser/xdp_packet_parser/src/main.rs |
ifaceis the network interface you want to monitor (e.g.,eth0,enp2s0, etc.).
Building and Running
Build the eBPF program:
1
2cd xdp_packet_parser/xdp_packet_parser-ebpf
cargo +nightly build --release -Z build-std=coreRun the user-space loader:
1
2
3cd xdp_packet_parser
RUST_LOG=info sudo -E ~/.cargo/bin/cargo run -- -i <network-interface>
Example: RUST_LOG=info sudo -E ~/.cargo/bin/cargo run -- -i enx7e0f7f73b679If you don’t see output, try a different network interface:
1
ip link show
This will list all available interfaces.
You can also use tcpdump to see if packets are arriving:
1
sudo tcpdump -i <network-interface>
If everything is working, you should see logs like:
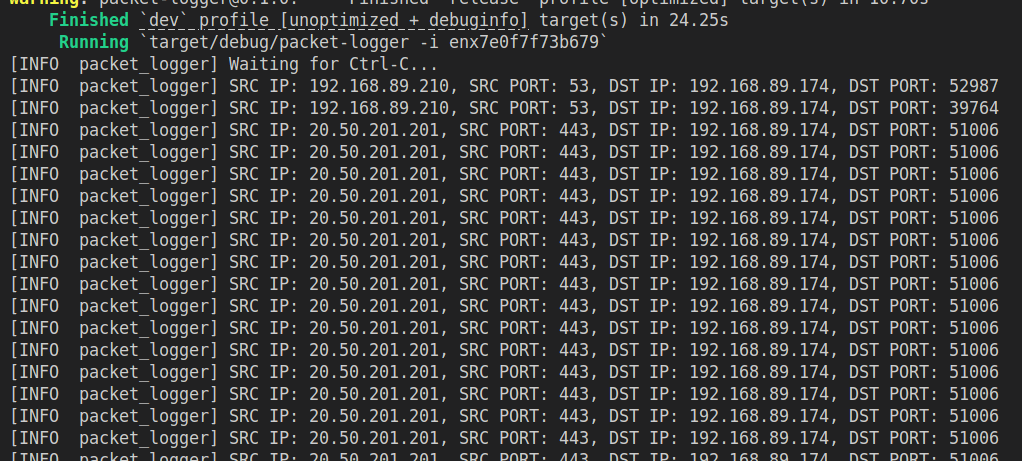
Congratulations!
You now have access to all the critical parameters from network packets at the lowest level possible.
From here, you can add custom logic to block, redirect, or analyze traffic—building your own high-performance network tools.
Follow ,like ,repost ,comment

References
In future blogs, we’ll continue exploring system tracers and Linux trace calls. Stay tuned!